
DAX Optimizer can serve as a diagnostic tool to validate the quality of DAX measures in a semantic model before deploying updates to production. While its primary use is to detect significant bottlenecks in a model, regular use ensures a minimal number of critical issues in the DAX code. This continuous review is particularly crucial when a team of developers maintains a semantic model, as it helps adopt best practices for writing clear and efficient DAX code.
Complete automation of this process involves executing the following steps without user interaction:
- Extract the VPAX file from the semantic model.
- Analyze the VPAX file with DAX Optimizer.
- Accept or reject the deployment based on the analysis results.
We describe these steps in more detail in the following sections. Additional information can be found in the automate analysis documentation. Although the examples use Azure DevOps, you can automate the process in many other ways, as the command-line tools are supported for Windows, macOS, and Linux.
Unattended extraction of the VPAX file
The VPAX command-line tool extracts statistical information from a semantic model and stores it in a VPAX file. The user running the command-line tool must have the rights to execute data management views, similar to other tools like Bravo for Power BI or DAX Studio.
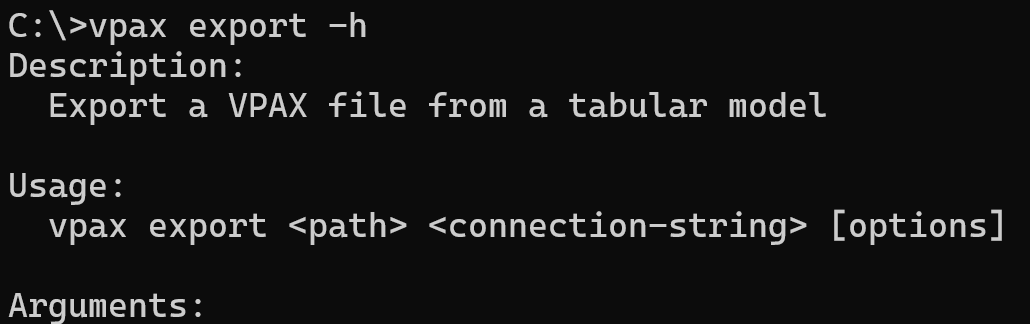
Authentication must be completed by the environment executing the VPAX command-line tool. If you run the VPAX tool interactively in a command line, you may be prompted to log in with Entra ID on Windows, though this type of authentication is not yet supported by Microsoft on other operating systems. For unattended execution, you should use a service principal, as described in the following articles:
- Service Principal access to dedicated capacity XMLA endpoint
- Automate Premium workspace and semantic model tasks with service principals
Unattended analysis of the VPAX file with DAX Optimizer
The next step is to send the VPAX file to DAX Optimizer and wait for the analysis to complete. The DAX Optimizer command-line tool has several parameters to control the service connection and the expected behavior in case of issues.
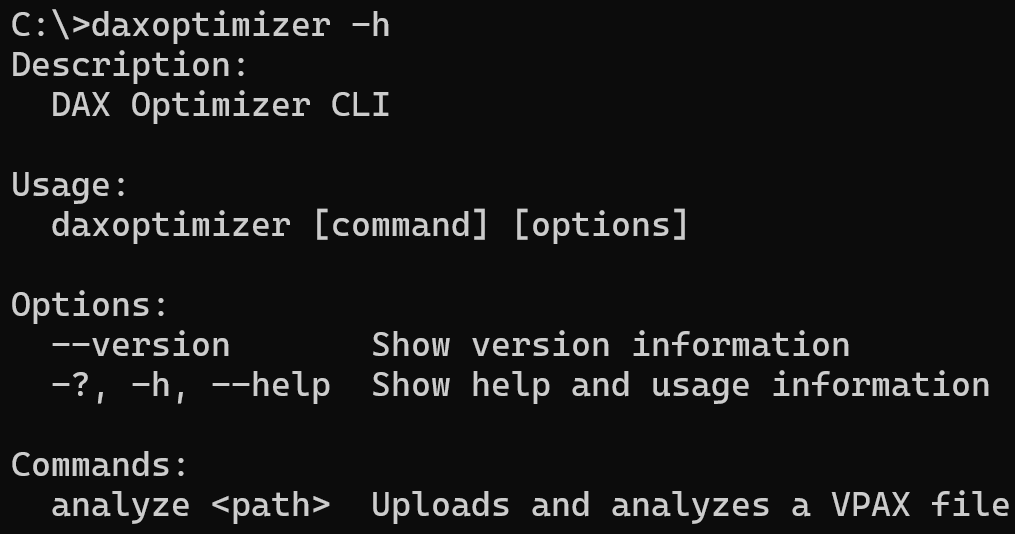
This tool must wait several minutes for the service to complete the analysis. You can control whether the result of the command-line tool reports an error if issues are found in the model. This way, you can manage the next step of a deployment pipeline.
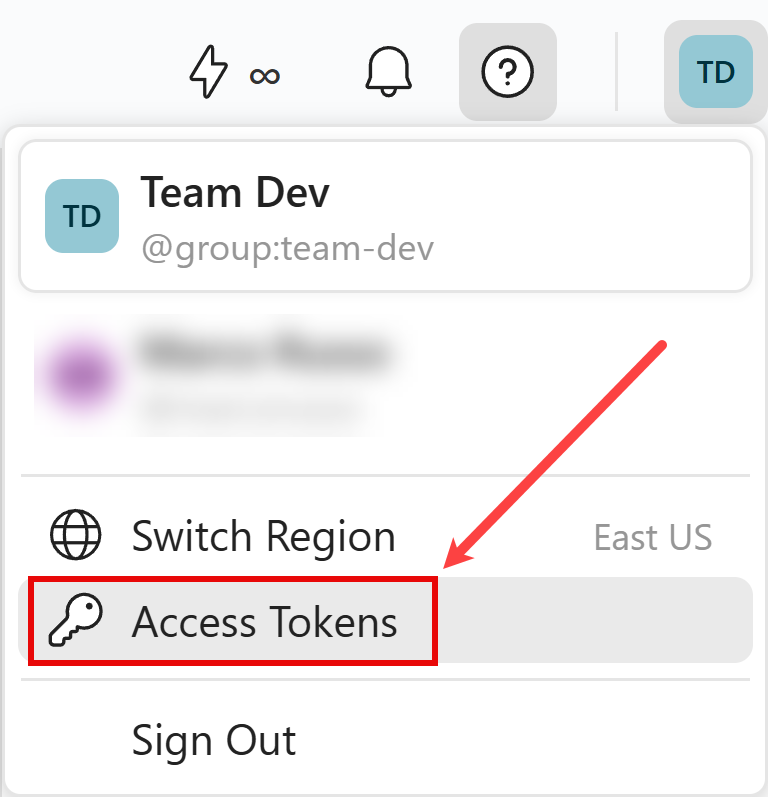
The authentication to DAX Optimizer requires a Personal Access Token that you can create from the Access Tokens menu.
Unattended acceptance or rejection of the deployment
If you use Azure DevOps, the result of a command-line tool can either continue or stop the execution. By setting the DAX Optimizer command-line tool to fail if one or more issues are detected, the subsequent steps of the deployment pipeline will not be executed. You can find a YAML example automate analysis documentation.
Other deployment automation tools can use the same principles. In this first version, we do not provide a way to selectively identify which issues should stop the deployment and which ones can be ignored automatically. Based on customer feedback, we may add this functionality in future releases.