
DAX Optimizer, a powerful tool designed to enhance the efficiency and performance of DAX expressions in Power BI models, has been updated to version 1.2. This latest version introduces a new set of evaluation metrics to provide a more granular and accurate assessment of performance issues. These enhancements enable developers to prioritize and address the most impactful issues more effectively.
In previous versions, DAX Optimizer assigned a uniform Relevance score to all issues within the same measure, often leading to an oversimplified view of their impact. With version 1.2, this approach has been refined by introducing specific Impact metrics for CPU and RAM. These metrics are calculated based on the particular code sections affected by each issue, offering a more nuanced view of their potential optimization benefits. By considering both the CPU and RAM impact and the measure’s relevance, the new metrics provide a clearer picture of which issues are most critical to address.
Changes in the Overview page
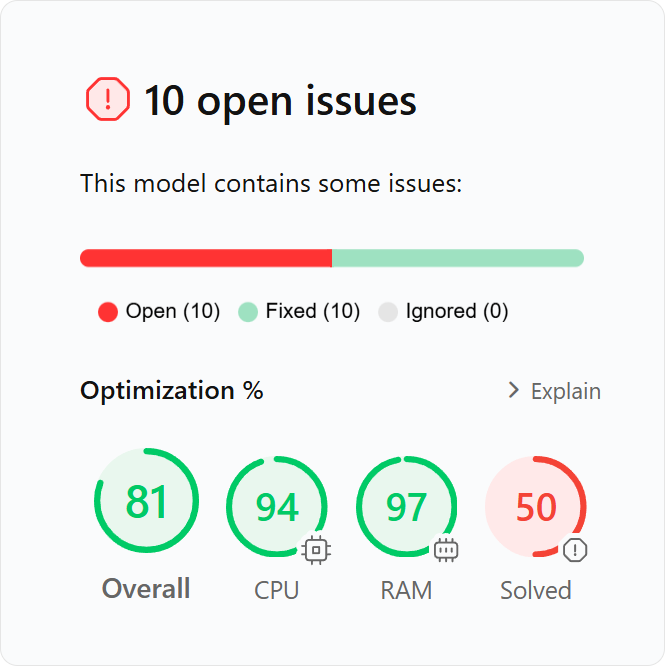
The CPU and RAM metrics in the overview pane give a quick overview of the open issues’ overall impact on the model. The value 100 describes a model without issues detected, while lower values indicate that the issues could impact the performance up to a certain percentage of the model. Remember, a single report could be affected by a single measure, and the lack of issues does not mean that the model is optimal but that no issues are detected.
The Solved metric shows the percentage of identified issues that have been resolved, providing a measure of progress and ongoing optimization efforts.
The Overall metric is the mean value of CPU, RAM, and Solved metrics. It offers a quick glance at the model’s general state of performance issues.
Changes in the Issues page
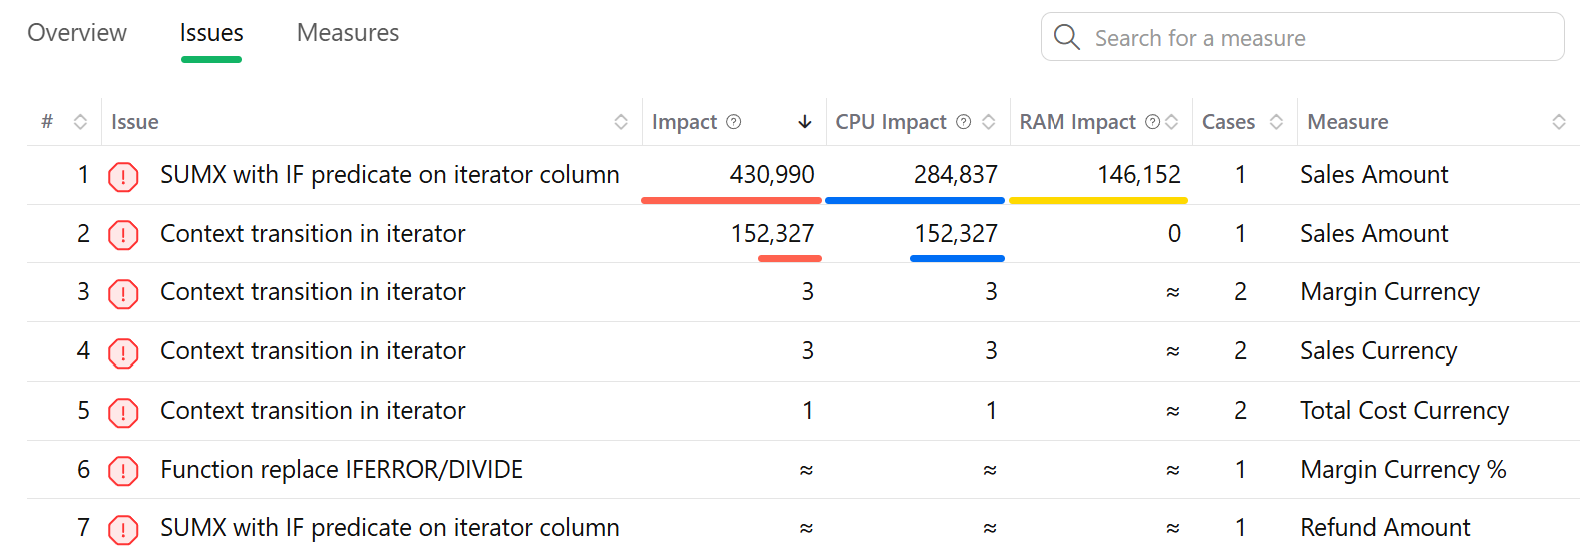
Each issue no longer has a Relevance metric. Instead, it displays the new Impact metric, computed by considering how much the issue impacts the performance of CPU and RAM. As usual, the absolute number of these metrics is not important, what matters is the comparison with other issues and measures.
Conceptually, a measure has an estimated cost in CPU and RAM. Each issue could be responsible for part of that cost, so fixing the issue could decrease its related cost. If a measure has multiple issues, the issues’ aggregated cost could exceed the measure cost: this is expected, and it helps raise the priority of those issues.
In Expert View mode, you can also see the metrics CPU Impact and RAM Impact, the two elements considered to compute the Impact value. You can show these metrics to get a better idea about the type of bottleneck produced by each issue.
From a practical point of view, nothing changes much: you should start to fix the issues with the highest impact. However, you can always decide to fix all the issues in a slow measure, including those with a low impact, because sometimes it is more productive than switching from one measure to another continuously during the optimization job.
Changes in the Measures page
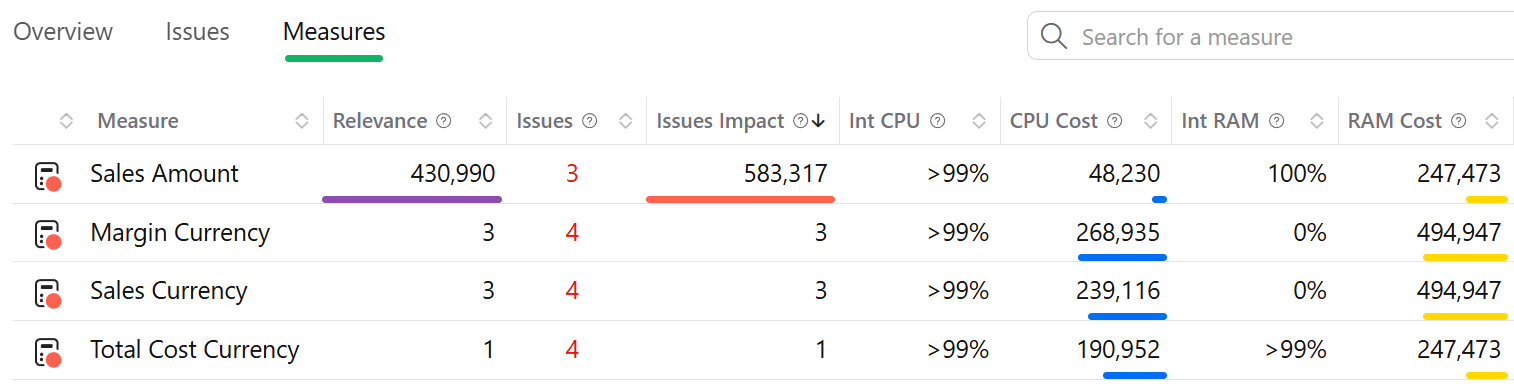
Besides improving the descriptions and documentation of the metrics on the Measures page, we added a column called Issues Impact in Expert View. The Issues Impact is the sum of the Impact metric of all the issues in the selected measure.
The goal is to highlight these different conditions of measures:
- Slow measures that can be optimized: High value in Relevance, high value in Issues Impact.
- Slow measures that cannot be optimized: High value in Relevance, small value in issue impact. In this case, the issue’s impact could be smaller than that of other issues, but it is still important for the user experience. However, after the issues have been fixed, the measure will still be slower than other measures in the model.
- Inexpensive measures that can be optimized: Low value in Relevance, high value in Issues Impact. The measure can be optimized, and some performance improvement could be visible. However, because of the low relevance, the measure could be rarely used, or it has few references from other measures.
- Inexpensive measures that cannot be optimized: Low value in both Relevance and Issues Impact. You should optimize these measures only after you fix other more important measures and issues.
Conclusion
The new metrics introduced in DAX Optimizer 1.2 provide a more detailed and actionable understanding of performance issues in DAX models. By focusing on CPU and RAM impacts, developers can prioritize their optimization efforts more effectively, ensuring better performance and cost-efficiency. For more detailed information on these metrics and how to use them, visit the Metrics page in the DAX Optimizer documentation.